- 본 게시글은 Factory Physics(3e, Wallace J. Hopp) 공부 정리글입니다.
- 개인적인 생각과, 책에 서술되지 않은 내용이 추가되었을 수 있습니다.
- 잘못된 이해에서 비롯된 오류는 지적해 주시면 감사하겠습니다.
개념 정리
- throughput(TH, 산출량): throughput is defined as the production / unit time that is sold
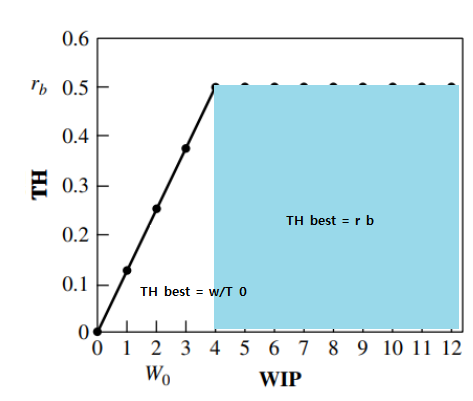
- bottleneck rate(r_b): rate of the workstation having the highest long-term utilization
- raw process time (T_0): sum of the long-term average process times of each workstation in the line
- critical WIP (W_0): WIP level for no variability achieves max throughput (r_b) with min cycle time (T_0)
Next, we examine the relationships among WIP, throughput, and cycle time in a single production line. For the sake of discussion, we assume that the WIP inventory level is maintained at a constant.
Best-Case Performance
throughput 은 기계 사용률이 최대에 도달하면 더 이상 증가할 수 없다. 반면에 Cycle Time은 waiting time이 증가하면 계속 증가할 수 있기에, 다음과 같은 그래프를 그릴 수 있다.

Little’s Law
https://en.wikipedia.org/wiki/Little%27s_law
Little's law - Wikipedia
From Wikipedia, the free encyclopedia Theorem in queueing theory In mathematical queueing theory, Little's law (also result, theorem, lemma, or formula[1][2]) is a theorem by John Little which states that the long-term average number L of customers in a st
en.wikipedia.org
Applying Little's Law to Work in Progress (WIP) is as follows.
*TH=산출량, CT=사이클타임
Next, we will explore the formulas for Best, Worst, and Practical Worst-Case Performance
Best-Case Performance
The minimum cycle time for a given WIP level w is given by
I believe the reason for the emergence of the above equation can be understood by dividing the portion in Figure 7.8 into the segment that maintains a constant T_0 and the segment that does not

The maximum throughput for a given WIP level w is given by
For the same reason, the above equation can be deduced from Figure 7.8
Worst-Case Performance
The worst-case can occur when working in batches. Instead of progressing to the next step based on the order of individual work completions, all products within the batch must be completed before advancing to the next step. For instance, if there are 4 items in one batch, you would need to wait for an additional 4 times the duration before moving on to the next step.
Practical Worst-Case Performance(PWC)
Neither the best nor worst cases examined above incorporate randomness. However, as reality often involves randomness, we now consider the practical worst-case, taking randomness.
Practical Worst-Case (PWC) is consistently positioned between the best and worst cases.

참고 문헌
[1] Hopp, W. J., & Spearman, M. L. (2011). Factory physics. Waveland Press.
[2] 위키백과. Little's law. https://en.wikipedia.org/wiki/Little%27s_law
'공부 정리 > Factory Physics' 카테고리의 다른 글
| [Factory Physics] 8. Variability Basics (3) (0) | 2024.02.20 |
|---|---|
| [Factory Physics] 8. Variability Basics (2) (0) | 2024.02.20 |
| Kanban System(간판 시스템, 칸반 시스템) (0) | 2024.02.19 |
| [Factory Physics] 8. Variability Basics (1) (1) | 2024.02.12 |
| [Factory Physics] Chapter 6 (0) | 2024.02.03 |


